

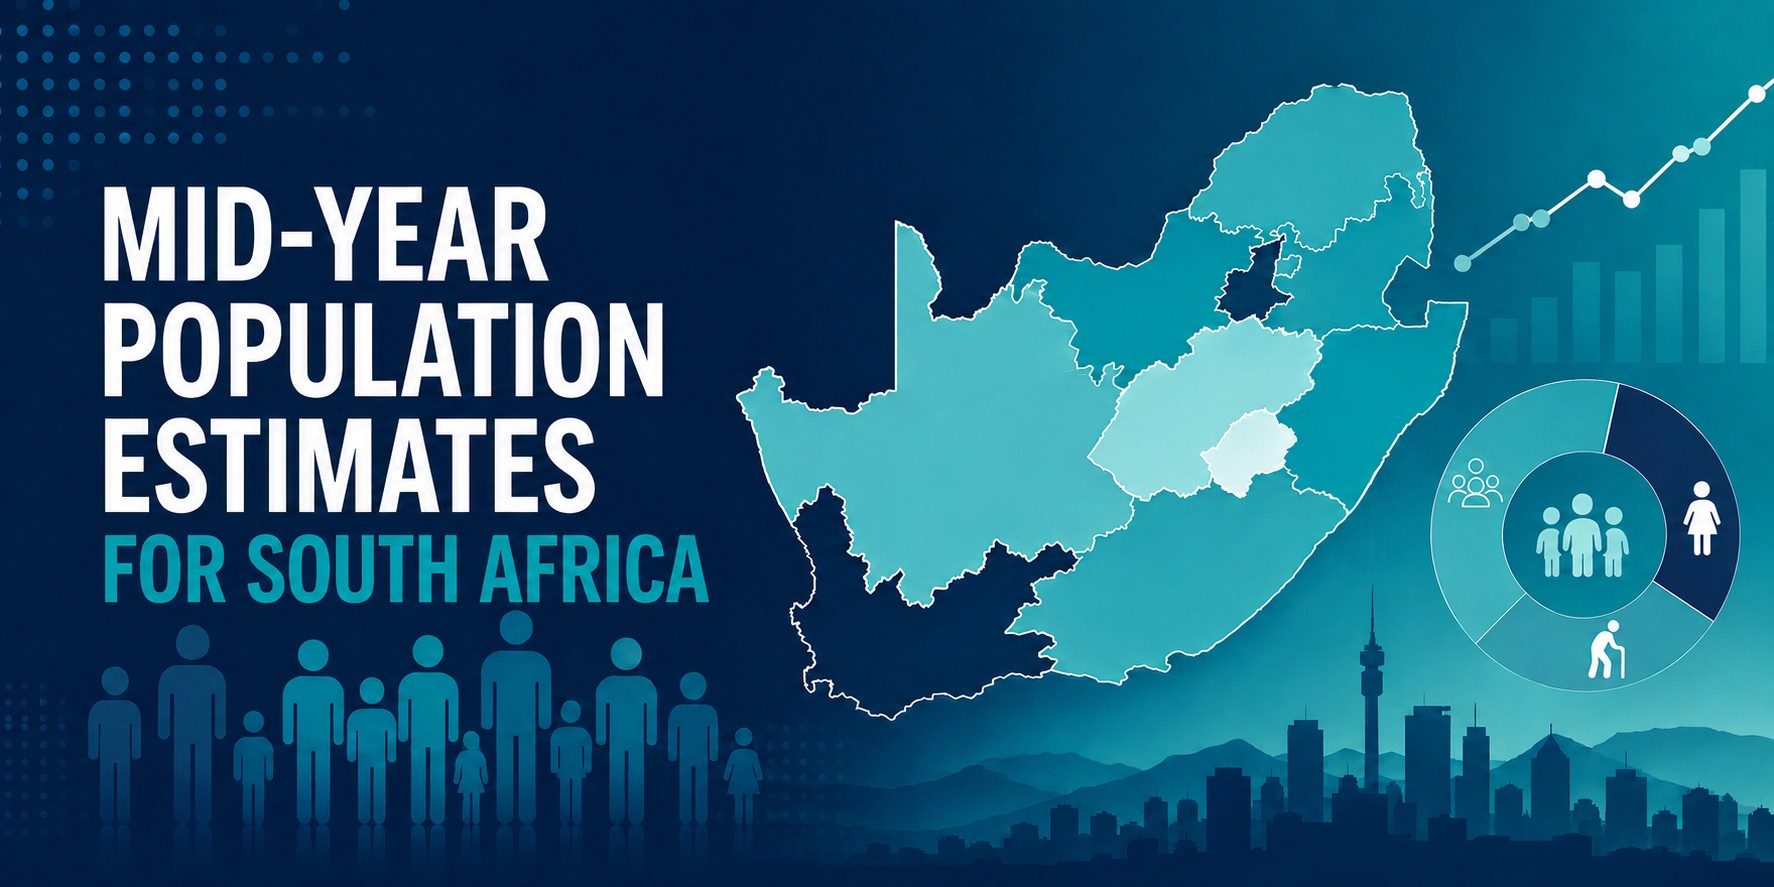
The BMR at Unisa recently released its annual mid-year population estimates for South Africa. The report places the country’s population at 65 098 552 people at 1.1 percent more than the mid-2025 estimate. Behind the national growth figures lies a more complex story: South Africa continues to grow, but the pace of growth is becoming increasingly uneven across provinces, cities and neighbourhoods.
Viewed nationally, South Africa’s population profile appears relatively stable. A closer reading of the estimates, however, reveals a far less uniform picture. The data show substantial differences in where people live, where new growth is being absorbed, which places are losing residents, and how the country’s age structure is changing.
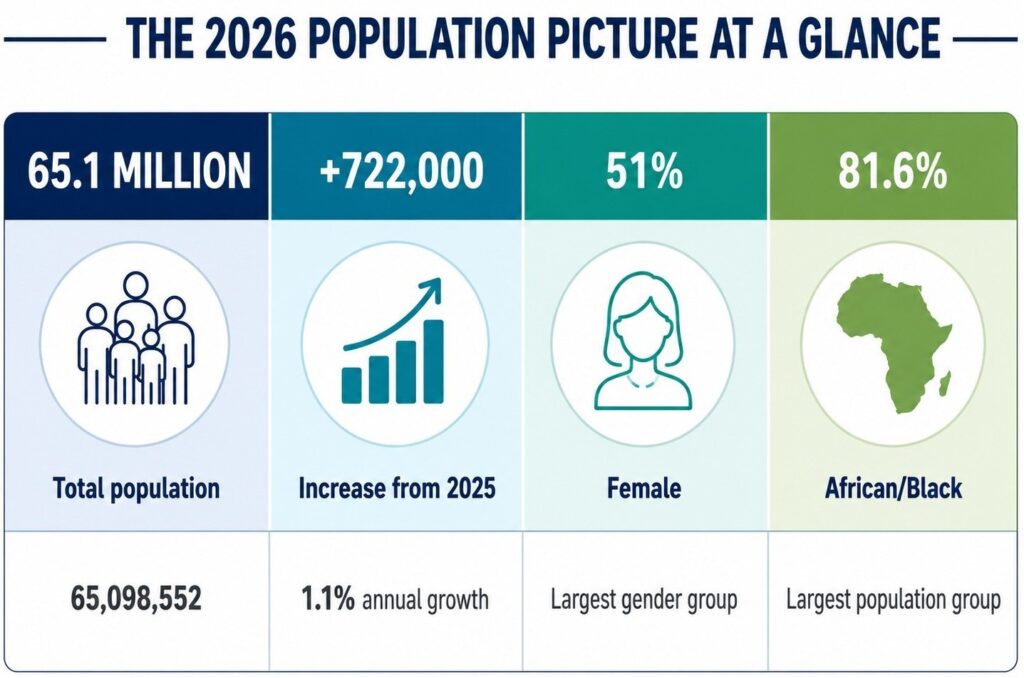
Five Structural Shifts Emerge From The Mid-2026 Estimates
1. Population Growth Is Slowing
One of the clearest trends in the report is the continued slowing of population growth. South Africa is still adding people each year, but at a lower rate than in earlier periods. Average annual growth was 1.6% between 2011 and 2016 and 1.7% between 2016 and 2021, before easing to 1.3% between 2021 and 2025 and to 1.1% over the past year.
This gradual deceleration provides the backdrop to the other shifts identified in the estimates, namely the country is continuing to grow, but the pace and location of that growth are changing.
2. Growth Is Becoming Increasingly Concentrated
The report also shows that population growth is becoming more geographically concentrated. Gauteng, KwaZulu-Natal and the Western Cape together are home to nearly three out of every five South Africans.
The concentration becomes even more pronounced below provincial level. Five metropolitan areas account for more than one-third of the national population, while just 100 sub-places captured approximately one-third of all population growth recorded since 2011.
Taken together, these figures point to a population landscape in which a relatively small number of places are absorbing a disproportionate share of South Africa’s growth.
3. A Two-Speed Country
Provincial growth rates further illustrate how sharply population trajectories are diverging. Gauteng, which accounts for 25.8% of the national population, grew by 1.6% over the past year. The Western Cape, home to 11.9% of the population, grew by 1.5%.
At the other end of the spectrum, the Free State grew by just 0.2%, roughly one-eighth of Gauteng’s rate. Gauteng and the Western Cape alone added close to 385,000 residents in a single year. The comparison shows why the national growth rate cannot be read as a uniform experience: provinces are moving at markedly different demographic speeds.

4. Growth And Decline Are Happening Side By Side
The divergence is even more visible below provincial level. The report records places within the same metropolitan economy moving in opposite demographic directions, sometimes only a few kilometres apart.
Johannesburg provides one of the clearest examples. Since 2011, Bryanston gained approximately 94,000 residents while Hillbrow lost approximately 63,000 – two suburbs in the same city, about ten kilometres apart, moving in opposite directions. Similar contrasts appear in Cape Town, where five of the country’s fifteen largest population declines were recorded on the Cape Flats. Delft, Browns Farms, Tafelsig, Langa and Ikwezi Park each declined by 30,000 residents or more, while Philippi, within the same metro, gained approximately 50,000.
These contrasting local trajectories demonstrate how much can be hidden by broad municipal and provincial averages.
5. South Africa Is Young – But Ageing Fast
The age profile adds another layer to the picture. About a quarter of South Africans are under the age of 15 and roughly 68% are of working age, yet the longer-term trend is clearly towards an older population.
Since 2011, the number of children under 15 has increased by only 2.6%, while the population aged 65 and older has grown by approximately 79%. The report notes that old-age dependency is climbing about 1.5 times as fast as youth dependency is falling.
The estimates place South Africa near the peak of its demographic dividend, the period in which the working-age share of the population is at its highest although South African cannot capitalize on this dividend due to very high levels of unemployment, and here especially youth unemployment. The BMR’s estimates suggest that from about 2027 the dependency burden is expected to begin rising structurally as population ageing continues.
That shift is already uneven across the country. Gauteng has about 38 dependents for every 100 working-age people and the Western Cape 41, compared with 61 in Limpopo and 58 in the Eastern Cape.
Beyond The National Average
Taken together, the findings describe a population landscape that cannot be captured by a single national growth rate. South Africa is still growing, but more slowly; growth is becoming more concentrated; some places are expanding while others are losing population; and the age structure is beginning to shift more decisively towards ageing.
For those using population estimates to understand change, the question is therefore no longer only “How many South Africans are there?” It is also “Where is the population changing, in which direction, and who makes up that population?”
This is where the geographic depth of the mid-2026 population estimates becomes particularly significant. The analysis extends to more than 22,000 sub-places, with estimates by age, sex and population group, allowing national and provincial trends to be examined at the level of individual communities.
Commenting on the findings, Ms Zuzitzka Janz, Senior Researcher at the BMR and lead author of the population estimates, said: “South Africa’s population future cannot be defined by one national average, but by the diverging realities of its places, provinces and people. The country is growing and slowing at the same time and urbanising and emptying out at the same time. None of that is visible in the national figure. That is why BMR takes its population estimates down to sub-place level, the level at which the data begins to connect with lived experience and national trends become local realities. Because behind every number is a person. Behind every projection is a heartbeat.”
About the Report
The Population Projections Series – Mid-2026 Edition (Report 547) was compiled by the BMR to support planning, policy, investment and development decision-making. Estimates are nationally benchmarked and published at national, provincial, district, municipal, main-place and sub-place level, with breakdowns by age, sex and population group.
Report compiled by: Prof DH Tustin, Ms Z Janz, Prof CJ van Aardt and Ms J Meiring.